Bidding Wars Don't Predict Home-Price Growth
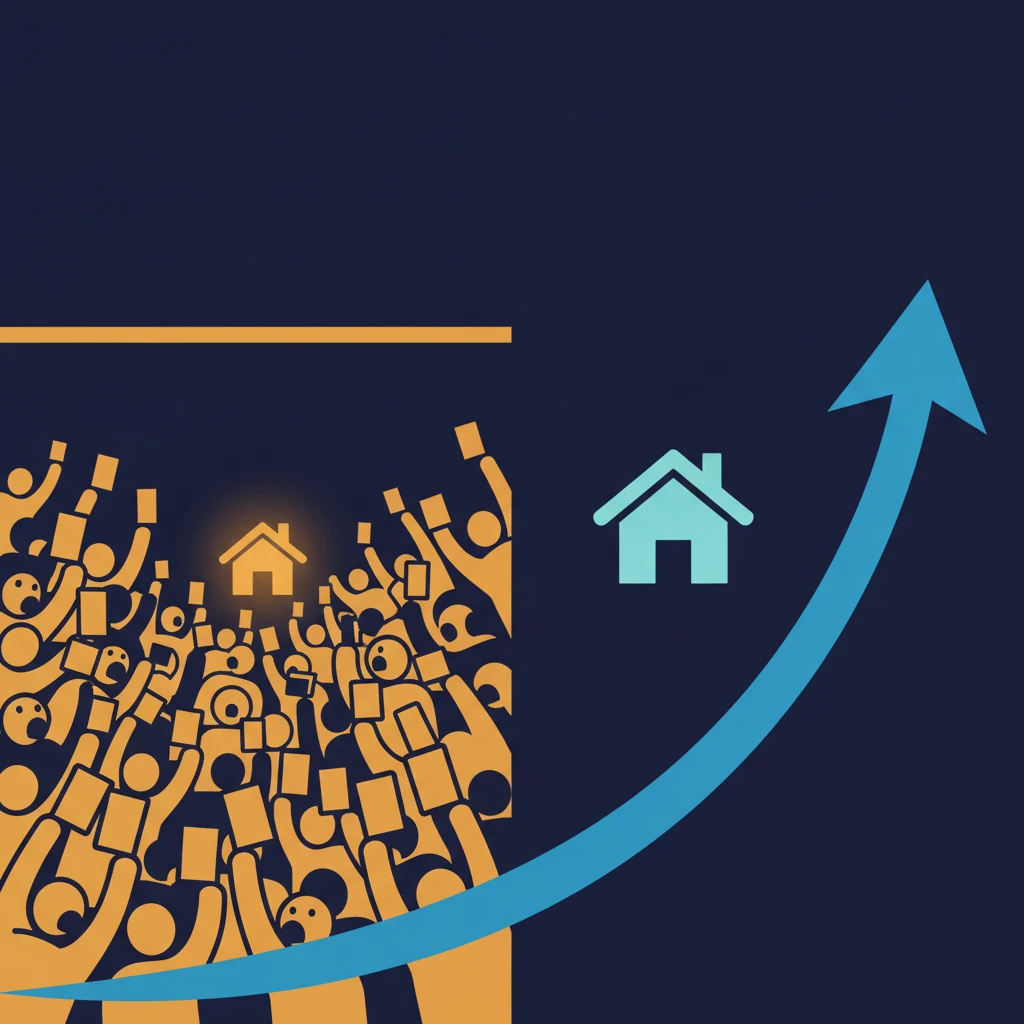
In Monroe County, New York — greater Rochester — 84% of homes sell for more than the asking price, and the typical listing is gone in eight days. Stand in a market like that and it feels like the future: everybody wants in. Fifteen hundred miles south, in Harrison County, Mississippi (Gulfport–Biloxi), only about 15% of homes clear above list, and the typical one sits for roughly 50 days. Calm. Unhurried. Easy to make an offer under asking.
Now the twist. Our model forecasts Harrison County to appreciate more over the next five years than Rochester — a projected ~40% versus ~30%, one of the strongest outlooks in the country against a middling one. The frantic market has the weaker forecast. The sleepy one has the stronger. That is not a lucky pair: across the 578 largest U.S. counties, how hard buyers compete for homes today explains almost nothing about where prices are forecast to rise. Redfin county market data; BoomTownIndex forecast model.
Market heat and the growth forecast barely move together
The statistical link is almost invisible. The correlation between a county's share of homes selling above list and its five-year price-growth forecast is 0.05 — on a scale where 0 is no relationship and 1 is perfect. Squared, that means bidding-war intensity accounts for about two-tenths of one percent of why one county's forecast differs from the next.
| How competitive the market is now | Avg. 5-yr forecast | Avg. days on market |
|---|---|---|
| Fierce — 40%+ of homes sell above list | 26.9% | 26 days |
| Slack — under 15% sell above list | 25.6% | 61 days |
Competition varies enormously — one group's homes vanish in under a month, the other's linger past two — while the forecast moves barely a single percentage point. To be precise, the relationship isn't negative: the hotter markets forecast a hair higher, on average. It's just so weak that knowing how fierce the bidding is tells you almost nothing useful about the growth ahead.
The fiercest competition is in the Northeast, not the Sun Belt
This cuts against the mental map most relocation shoppers carry. The bidding wars everyone pictures in Austin or Tampa have largely moved north. Group the big counties by region and the pattern is stark:
| Region | Months of supply | Sell above list | Days on market | Avg. 5-yr forecast |
|---|---|---|---|---|
| Northeast (102 counties) | 3.2 | 44% | 31 | 28.5% |
| Sun Belt (188 counties) | 6.9 | 15% | 59 | 24.9% |
The competition gap is huge — a Northeast home is roughly three times as likely to sell above list — while the forecast gap is small and, again, points the other way only slightly. The mechanism is supply, and it shows up in the site's own data: Sun Belt counties pulled about 8 building permits per 1,000 residents last year; Northeast counties about 2.4. Census Building Permits Survey. Where builders keep adding homes, buyers get breathing room even when demand is strong; where construction is constrained, an ordinary amount of demand curdles into a bidding war. (Other forces — rate lock-in, coastal insurance costs — plausibly matter too, but those are interpretations, not something measured here.)
Why the two numbers measure different things
Competition is a snapshot of right now. The Boom Town Index forecast is a different animal: a machine-learning model trained on about twenty years of county data that predicts each county's home-price growth relative to the national rate, built from momentum in prices, GDP, jobs and permits plus structural factors like taxes, education and amenities. BoomTownIndex model (compute_scores.py).
But a calm market isn't automatically a bargain
It's tempting to flip the headline into a rule — buy where it's quiet. That's just as wrong. Some of the calmest markets in the country carry the weakest forecasts. Buncombe County, North Carolina (Asheville) gives buyers plenty of room — homes linger about two months, few sell above list — and lands near the bottom of our forecasts. Laredo's Webb County, Texas is quieter still, with nearly ten months of supply, and its outlook is only modest.
The point isn't "hot bad, calm good." It's that a market's temperature — hot or cold — is close to irrelevant to its growth outlook. The two questions have to be judged separately.
How to use this before you move
Split the decision in two.
- How much of a fight is buying here, right now? Look at months of supply, days on market, and the above-list share. High means bidding wars, waived contingencies, and little room to negotiate. Low means time to think and leverage to push back on price.
- What's the price-growth outlook? A separate question — and market heat won't answer it. Look at the fundamentals: the Boom Town score and forecast, which you can browse on the fastest-growing counties ranking or any individual city page.
Don't let a bidding war convince you a place is a great long-term bet, and don't let a slow market convince you it's a bad one. If you want the appreciation lens on its own terms, our guide to reading a Boom Town score and the most undervalued housing ranking are better guides than the crowd in the driveway.
And the standing caveat: the forecast is a model's best estimate, not a promise. Five-year projections carry real uncertainty and can be knocked off course by rate moves, local shocks, or a wave of construction. Use it to compare places against each other — not to bank a specific number.
The frenzy you feel walking into an open house is information about this month's supply and demand. It is not information about the decade ahead.
Frequently asked questions
Does winning a bidding war mean I overpaid?
Not necessarily — it means supply was tight when you bought. Whether that price looks smart in five years depends on the county's growth fundamentals, which how-hard-you-competed doesn't capture.
If competition doesn't predict growth, what does?
In our model, momentum in prices, jobs, GDP and building permits, plus structural factors like taxes and amenities — not how many offers a house draws this weekend.
Should I just shop the slowest markets, then?
No. Some slow markets carry weak forecasts too — Asheville and Laredo among them. Slow means negotiating room, not a guaranteed bargain. Check the growth outlook separately.