America's Population Growth Just Halved — and the Places Absorbing the Movers Rank Worst for Home Prices
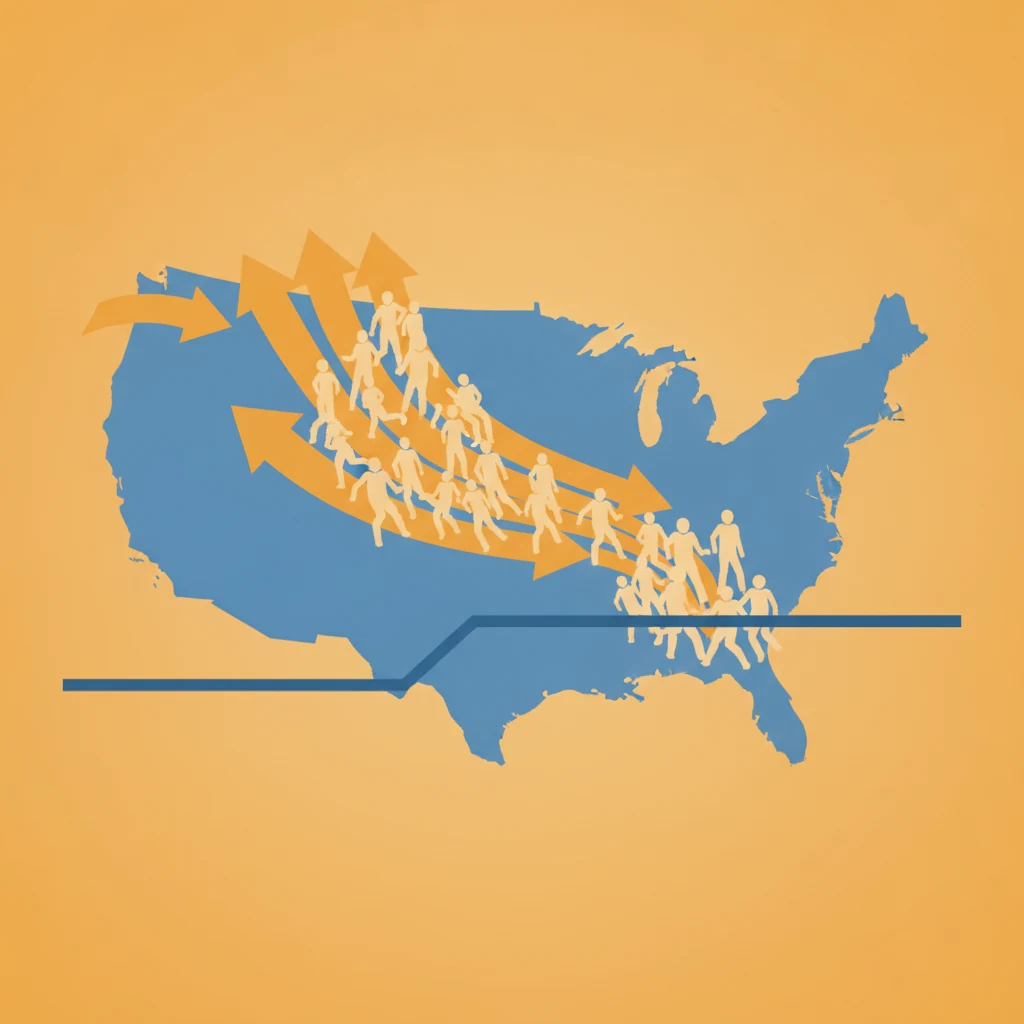
The country added about 1.8 million people last year. The year before, it added 3.2 million. In the span of a single Census release, America's population growth got cut nearly in half — and almost the entire drop traces back to one number falling off a cliff: international migration.
Strip that out and what's left of the country's growth is a reshuffle. People aren't so much being added as rearranged, and they're rearranging themselves in a very specific direction: out of the biggest metros and into a thin strip of the Southern coast. The intuitive read is that those destination counties must be the boom towns of the moment — get in before the crowd does. Our model reads the same map and reaches the opposite conclusion. The places soaking up the most movers are, with a couple of instructive exceptions, the ones it forecasts to grow home values the slowest.
The engine that lost a cylinder
The Census Bureau's Vintage 2025 county population estimates, covering the year from July 2024 to July 2025, are the bleakest headline-growth numbers in a decade. Nine out of every ten U.S. counties saw lower net international migration than the year before, and that single lever — not deaths, not domestic moves — is what dragged national growth from 3.2 million down to 1.8 million.
The slowdown is broad. Of the roughly 2,000 counties that were growing the prior year, nearly eight in ten saw that growth slow or flip into decline. When the immigration spigot narrows, the map goes cold in a hurry, because international arrivals had been quietly propping up population in hundreds of counties that lose people to domestic migration every year.
The one engine still running
That internal reshuffle is the whole story now, and it has a clear shape. The 50 most-populous counties in the country — the Los Angeleses and Cook Counties and Harris Counties — collectively lost a net 637,634 residents to domestic migration in a single year. Those people didn't vanish; they landed somewhere. And the somewhere, over and over, is the Southeast coast. The fastest-growing counties in the nation now cluster in Florida, Georgia, South Carolina, North Carolina and Virginia, led by Jasper County, South Carolina, the single fastest-growing county in the country.
This is the map every "where Americans are moving" story is drawing right now, and as far as it goes, it's correct. People really are leaving the coastal-metro giants for cheaper, warmer, less-crowded Southern counties. The question we care about isn't where they're going. It's whether the places catching them are actually good bets for a buyer — and that's where our forecast splits from the migration map.
Where the movers are landing — and what the model says
Take three of the marquee destinations soaking up that outflow: Marion County, Florida (the Ocala metro), Horry County, South Carolina (Myrtle Beach), and Brunswick County, North Carolina (the fast-sprawling edge of Wilmington). All three are growing briskly. All three are exactly the kind of affordable Sun Belt county the exodus is feeding. And all three land in the bottom half of our Boom Town Index — the model's five-year forecast for home-price growth, scored 0 to 100 against every other county we rank.
| County (metro) | Pop. growth | New single-family permits | BTI score | Rank of 992 |
|---|---|---|---|---|
| Marion, FL (Ocala) | +3.2% | 5,420 | 14.6 | 847th |
| Horry, SC (Myrtle Beach) | +3.8% | 6,418 | 36.7 | 628th |
| Brunswick, NC (Wilmington) | +4.6% | 4,454 | 46.1 | 535th |
Marion County sits in the bottom 15% of the entire country for projected home-price growth; the model's five-year outlook for it is actually negative, expecting Ocala's home values to lose ground relative to the national market. Horry and Brunswick are less dire but still middling-to-weak — nowhere near the boom-town grade their crowds would suggest. These are forecasts, not prophecies, and county-level projections carry real uncertainty. But the direction is consistent, and it points the opposite way from the moving vans.
They're building it away
The model is a machine-learning system, not a tidy formula, so it doesn't hand you a reason. But the raw data underneath these three counties says one thing loudly, and it's sitting right there in the permit column: they are building homes almost as fast as the movers arrive.
Horry County pulled permits for 6,418 new single-family homes in a single year. Marion permitted 5,420. Brunswick — a county most Americans couldn't find on a map — permitted 4,454, nearly all of them single-family. These aren't gently growing towns; they're construction sites with a coastline. When a place can throw up new subdivisions as fast as demand shows up, the newcomers move into brand-new houses instead of bidding up the ones that already exist. Growth gets absorbed by supply, and prices go sideways.
It's tempting to assume these markets are simply overpriced and due for a correction — that the negative forecast is a bubble letting out air. The affordability data says otherwise. Marion and Horry are both cheaper relative to local income than the counties our model likes. This isn't a valuation that ran too hot. It's the more mundane, more durable ceiling: a market where cheap land and permissive building let supply keep pace with everyone who shows up. Cheap homes give you room to run; a flood of new construction hands that room right back.
The exceptions prove the mechanism
If population growth were simply poison for a forecast, this would be a much less interesting story. It isn't. Two of the fastest-growing counties in the same Southern boom score near the top of our rankings:
| County | Pop. growth | New single-family permits | BTI score |
|---|---|---|---|
| St. Johns, FL (Jacksonville) | +5.0% | 3,554 | 80.6 |
| Walton, FL (Panhandle) | +3.9% | 1,427 | 89.1 |
St. Johns is growing faster than any of the three laggards, and Walton nearly as fast — yet both score in the top fifth of the country. The difference isn't how many people are arriving; it's how much house is being built to greet them. Walton permitted barely a quarter of what Horry did. High-amenity, higher-income, and slower to sprawl, these are places where demand outruns supply rather than the reverse.
You can see the same logic from the losing end of the migration map. Kings County, New York — Brooklyn — is shrinking, down about half a percent on the year, and it still forecasts stronger than Ocala. Why? Because Brooklyn permitted 25 single-family homes all year. It physically cannot build its way out of demand. Population is leaving and the housing stock still can't loosen. That's the whole mechanism in one absurd number: 25 permits in a county of 2.6 million. Supply, not headcount, is what our model is really tracking.
What this means if you're the one moving
None of this is an argument against moving to Ocala or Myrtle Beach. If you want an affordable, well-supplied market with a beach nearby and you're not counting on your house to double, a low Boom Town Index score is arguably good news — it means you won't be bidding against a mob for scarce inventory. The score forecasts prices, not happiness.
It's a warning only for the specific person who reads a migration ranking as an investment tip. If that's you, the fix is to stop treating the crowd as the signal. A U-Haul rate or a "newcomers" headline tells you where people are going; it tells you almost nothing about what homes there will do next. We've made that case before from a few angles — that raw in-migration counts are mostly noise, that the building-permit data front-runs the real booms, and that there are tells that a hot county has already peaked. This is the newest and largest example of the same rule, delivered by the freshest Census data: watch what the builders are doing, not what the crowd is doing.
See your county's five-year forecast
Every county we score comes with its Boom Town Index, permit trend, and price outlook — the numbers underneath this story.
Browse the rankingsThe quick version
- Growth halved. National population growth fell from 3.2M to 1.8M in a year, almost entirely because international migration dropped in nine of ten counties.
- The remainder is a reshuffle. The 50 biggest counties lost a net 637,634 people to domestic migration, and the Southeast coast caught most of them.
- The catchers aren't the winners. Marion (Ocala), Horry (Myrtle Beach) and Brunswick all rank in the bottom half of our home-price forecast — because they're building single-family homes as fast as the movers arrive.
- Supply is the tell. The fast-growing counties that do score well (St. Johns, Walton) build less; even shrinking, supply-locked Brooklyn out-forecasts the boom towns. Twenty-five permits will do that.
The crowd tells you where the country is going. It doesn't tell you what the houses there are worth — and this year, more than most, those are two different maps.